Dymanic data on a Map - Easy method using Secret Camera object in Excel

Displaying excel data on a map is a complex task as of now.
First of all, you need to have Geocoding (latitude and longitude) of the places you want to map then create a KML map. Now, use either Internet or Google Earth to display map... It's really complex!

Here is a simple trick - hidden in excel!
This trick helps you display data automatically and with little tricks, you can make it dynamic.
You can also manipulate the data and display it by using a bit of imagination!

You got to use a "Camera Tool" in excel to do this
First, let me tell you where this Camera Object is hiding.... It's hidden in excel tools and you need to take it out first!

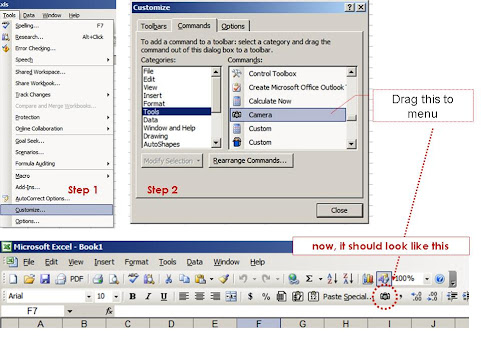
Step 1: Go to Tools on the main menu and click Customize
Step 2: In Customize,Go to Tools search for Camera.

Now hold that "Camera" and drag this to your to the toolbar on your excel.
Here is the picture to look at....
We are almost done!


In Excel 2010, The Navigation to find the Camera tool is here...


Now search for a map that meets your needs.
You can get enough and more on Google Image search - (Please check for copyrights...)
Paste the map on an excel sheet.
So now we have a Map pasted as an Image in excel and also the data to be displayed.

Now go the excel, select the range you want to display on the map
Click on the "Camera" - you will find the range - selected.
Now  - leave it on the map! Adjust the size. Do a bit of formating. Now you have the object on the map...

The magic with this is it carries the reference with it! 
Just to check, Select the object - you just left on the map. 
You will find its reference in the formula bar!
So, any change you make for the reference cell, the data in the object changes accordingly!

I added Increase and decrease tabs to make data dynamic.
You can use colours, In-cell Graphs, Dynamically change data...using the formula!
The trick is here for you to explore 
Rest, I leave to your imagination and innovation......explore it!

Take a look at the outcome.

Download the excel  here
Its a DO.. CO..MO.. stuff (Download, Copy ,Modify) You Can also download @downloads

Being Gandhi & Be in Gandhi

2'October , 143 rd Gandhi Birth Anniversary : Remembering Mahatma (Great Soul)

His Two Weapons  : Truth and non-violence.

Data Calisthenics : Gapminder Motion Chart - 5 ways to create these Motion Chart with your own data

Sometime back I wrote blog post on Gapminder.
It’s one of the most viewed posts. Here is the link for the same:
Having used and worked with the motion chart, I found that many are fascinated by the insights a Motion Chart (Gapminder) throws out. 
Boring stats Can be transformed into brilliant data dancing!
As I explore the Web world, I find many have tried various methods of presenting data the Gapminder way
Here I list out the possibilities I have come across.
It's a compilation of various methods of creating Motion Charts.
Each one is a masterpiece.. and efforts are worth a zillion claps....
The First: Use Google Docs
            The easiest way to make data dance.....
            Google Docs: MotionChart  : a Chart type in Google Docs
            Another link to explore is Quick Guide to Motion Chart
Here below is an example created by me with the Population and GDP of BRIC TM over a period of time.
The Second: Use Excel
            Making it possible in excel
Jon Peltier, author of the famous site http://peltiertech.com writes a post on how you can create motion charts in excel. Here is the link to his post
Jorge Camoes in his famous blog excelcharts. Here is his post
Anand from his brilliant blog http://www.s-anand.net/blog/
Here is the link to his post
The Third: Use Tableau
Andy Cotgreave in his Awesome Blog  Thedatastudio created a Motion chart with all possible paraphernalia on Tableau
here below are the links to his posts

The Fourth: Use Crystal Xcelsius
             http://www.ideas2evidence.com/showcase.html
             http://www.ideas2evidence.com/demos/CO2-demo.html

The Fifth : Use TrendCompass from Epic systems
          Trend compass is commercial software from Epic systems.
          Trend compass uses the basic idea of showing five variables in a single graph
          (X,Y,Bubble size, Bubble Color and Time) as a motion chart.
The user interphase is quite intuitive and simple to create Visualizations. However, for first time user, arranging data may be a challenge. The simple solution is to follow Trend Compass's instructions and their model of Excel to arrange data.
Trend Compass helps you present your business data from your own desktop without the hassle of connecting to the internet and hopping between presentation and web.
Here is a demo of Trendcompass from the website http://www.epicsyst.com/test/v2/mastercard_vs_visa/
You can download a demo version that works for 30 days....

For those who want to start from the basics, you can watch the video below from Steve


Last but not least...

You can download Gapminder for desktop
Yet another great site for data is OECD- Factbook
Though You can not use these with your own data, You have enough and more to explore..
Now...Play..... 

Problem ? I Google. I Solve.

Missing Excel 2010 Drag and Drop functionality.

'Excel 2010 has no drag and drop functionality' my friend declared.
He sulked....4 Months of suffering ....no solution…
I checked his computer. True. there is no drag and drop functionality. 

I checked my computer; Drag and drop are available… I thought it must be some excel setting.
So, I Googled.

The answer lies in a small tweak.
File > Options > Advanced
Enable fill handle and cell drag-and-drop: Ensure the box is checked.
Take a look at this Picture here the Box is not checked. So Check It....That's the Solution 


Problem? I Google. I Solve.
Four months of suffering  Vs.  Instant solution the difference is ….a friend called 


Sales Forecasting : Easy and Simple


Sales Forecasting is a Paradox. 

Theoretically, Faaaarther the Period, Poorer the Reliability.
Whereas, in the real world its the opposite...This month, not very sure; year end, guarantee. ;-)
I may not solve the Paradox but, here is a easy and simple tool to forecast sales.
Two simple rules and a bit of Stats were used to create this tool in Excel.
       ~ The near future most likely will be an extension of our known past....
           Like we know that tomorrow should more or less will be like today...The Armageddon is far away
       ~  Seasonality exists in sales and the reason may not always be the Mother nature
           Like we know soft drinks sell during summer and on a sales closing day, we do more sales
Download the Excel and take a look at the Powerpoint to understand and use the tool.
This is a DOCOMO stuff! (Download,Copy and Modify at your will...You can find them @Downloads

Wangiri Calls : One Ring and Cut Calls


India knows the "value" of nothingness.
Ancient India invented Zero. 
Modern India Invented missed Call.
The whole world embraced both the inventions with high intensity.
This post is about the making 'misuse' of the invention called 'missed call' by some unscrupulous people.
I recently received a couple of missed calls from overseas. I tried returning the call but heard a recorded voice say that this is an international call and is chargeable. Little unusual. 
So, I Goggled the number to find innumerable posts confirming that it is a fake call.
Yesterday another call with +44 identifiable as England. But the number is unknown.I returned the call but this time no recorded voice. So I had the chance of hearing some husky Ohs.. and acoustic Ahs.. (once again, recorded I believe!)
It took me about 7 sec. to understand that it’s a chargeable porn call. So I dropped the call. I am sure I must have been charged for those 7-8 Secs. at a premium rate. It makes sense to presume that these numbers are premium rate International calls.
So, the moral of the story is ….
India invented missed call! Others have created a business case around it.
What an Idea Sirji!
Indian missed call is Communication. Overseas missed call means Commercialization.
Action : Ignore missed calls from unknown numbers ( Called Wangiri Calls: literally,' One (ring) and cut')
PS: My Google Gyan: 

Computing trendline values in Excel

Forecasting is an Art,Science,Social studies,Maths and more 
From www.Forexmillion.com
Use of trends can make forecasting easy ! And God's gift to corporate mankind can make it easier !( Well, I 'am referring to Excel)
However, the trend line in excel does not display the values it holds. Computing the values on excel is an extremely confusing stuff .
You need to use innumerable formulae in excel to arrive at the values.
Just to make the job easy, here I present a way to do it. I have also attached an excel file link in the presentation. You can download the same and use it.
Alternatively you can download it from my BOX: Trendlines.XLS
Computing trendline values in excel