Numbers numbers all the way!

You often hear statements like "Our company has 2 billion dollar turnover"
Do you know what a billion is ? Can you write down the number ?
guarantee that most can not write this most often used number .I have an easy way to remember!

1,000 is 10 to the power of 3 - so to say one followed by 3 zeros 
                 i.e 10 X 10 X 10 written as 10^3

1,000,000 is 10 to the power of 6 is  Million....
1,000,000,000 is 10 to the power of 9 is a Billion 
1,000,000,000,000 is 10 to the power of 12 - Trillion

The trick is remembering  the 3 Table
  • 10^3 is Thousand,
  • 10^6 is Million,
  • 10^9 is Billion,
  • 10^12 is Trillion and
  • 10^15 is Quadrillion and so on....

Here are some fun facts:
Zillion : Means a very large number. This has no defined Mathematical meaning!

Googol : This is the number from where Our "Google" name originated!
googol means 10^100 ie 10 to the power of 100!, one followed by 100 zeros!

Googolplex :  Means  10^Googol ie 10 raised to the power of Googol
in Mathematical terms it is 10^10^10^2
I can not write this number @#$!%^&  
Sure, I am not going to get a job in a company that has a Googol or Googolplex dollar turnover!

Tree Maps

Have you ever heard of Tree Maps? In fact, a Tree map is a Big Brother of both Bar Charts and Pie Charts.
Tree-maps are a complex but powerful information visualization technique.
They were introduced in Shneiderman, 1992. Tree Maps are used to visualize hierarchical data as a set of nested rectangles.
As mentioned, the concept of tree-maps is basically from Ben Shneiderman an American computer scientist from University of Maryland as a solution to his problem of understanding and visualizing who is using how much of disk space ( It was 80 MB  of disk space shared by 14 people in those days ! )
You can read a wonderful article by Ben Sheneiderman titled " Discovering Business Intelligence Using Tree-map Visualizations.
Tree maps can show relatives size of each component in the hierarchy and also use color coding to show another attribute. Here is an example of a simple tree-map .
This picture is taken from Wikipedia
The size of Rectangle denotes the waiting time for patients in NHS Primary care Trust in UK.
There is  another variant of Tree maps that uses circles instead of rectangles. Someone called it as pebbles. Here is an example of a pebbles Chart.
This shows GDP Per capita of countries in PPP Terms in $ International
This is the same data in a Tree chart
Creating Tree-maps is a Complex work and need considerable skills . Here I provide you two easiest ways to create Tree maps.
      1. Use Microsoft Excel
      2. Use ManyEyes, an IBM Initiative to create and share data visualizations on Web
Visit my earlier Post on Many Eyes : Text Visualization-Many Eyes
Microsoft  Research Provides a Free excel Add-in, that makes the job of creating Interactive Tree Maps in Excel easy.
Here is the link to download Excel Add-in
1.Tree Maps Free Excel add in - Link 1

2.Tree Maps Free Excel Add in - Alternative Link from Microsoft Store.
for more advanced users who can handle xmls , Here is a site to download a Java based Tree visualization Programme. Here is the Link
According to the web site,
The project currently consists of a file browser demo, which visualizes the file system with the following tree diagrams:
  • Hyperbolic Tree
  • Circular Tree-map
  • Rectangular Tree-map
  • Sunburst Tree
  • Icicle Tree
  • Sunray Tree
  • Iceray Tree
Try few Tree maps now....

Beware... Busy Executive

I wish to draw the attention of  Busy Executive to the three most common pitfalls in using ... Google, Linked In and  Spell Check.

Inspiration from Google ;-)
Many a time you receive Motivating emails, Impressive quotations, elegantly crafted CVs, Well drafted letters and Reports with linguistic gymnastics.
Copy a couple of sentences and Google them. Bingo. 
You will reach the original article! The right word is Plagiarism.
It’s not uncommon for a busy executive to copy content from the Internet and create presentations and documents. The same is true while using documents from your colleagues.
Whenever you are dealing with office documents, you must remember, the official documents carry with them their properties.
What are the properties of a document?
Go to FILE in the menu on the document >> Click on PROPERTIES
You will be amazed to see the extent of information available.
Details like TITLE, AUTHOR may cause embarrassment if you have copied someone else’s file and updated the same file.
Change the author's name and other properties if you wish to avoid embarrassments.
Maybe many are not aware of the document properties… However, YOU must know!
Imagine if you had copied the CV format of your colleague and just changed the contents here and there and it goes to an HR guy who knows how to check the properties of a document!
The embarrassment is completely avoidable.
LinkedIn
LinkedIn… it's powerful with more than 175 million users. 17 Plus are from India!
India rocks with second-highest users after the USA17 Plus Mio are from India!
If you wish to use LinkedIn for “personal branding”, do not forget to…

Be visible…add Photo, complete profile in all respects.
Recommendations …get them.
Add value …join groups and participate in discussions.
Network … connecting is not collecting…
Differentiate yourself by demonstration of skills through Slide share and Bolg link..

Though certain exposure is important, overexposure may be counterproductive! If you want to protect your privacy, change the settings so that, you can control who can see your updates!
Click to enlarge
Spell Check :
Today’s executives in most corporates are either Gen X or Gen Y who were brought up in the internet milieu and very few have learned traditional, almost extinct typewriters! 
The result is a high degree of dependence on computers!
With extensive use of computers, you are vulnerable to bloopers!
Blooper!
Complete faith and trust in spell checker!
A spell checker can guarantee you "correctly spelt words in a wrong context!"

sea this example 

Dear Mad am,
I am Robert. This has reference to the telecon we had this morning regarding the role of communication export. I understand that man ageing communications is knot a joke. I am glad to inform that I attained expertise in this field as manger communications as I lead a team. I am known to be an excellent pubic speaker. would love to meat you in person to discus the some issue. I request you to send me the data and time for meeting. Please do give a massage to confirm the same. Mr. James, the HR executive must also be waiting for this massage to insure that he is present during the meeting. Please piss on the information. The summery bellow should help you prepare for the meeting. I wish to inform you that seven mules and one female colleague from our department will also be cum and  attend the meeting.
Warm regards,
Robert
Not even a single spelling error! WOW!
All errors are typo errors! 
Most often, the problem is homophones ,similar sounding words like “their” and “there” and also with similar spelling words like “manager” and “manger”.
Check the list of British English Homophones
However, Good News is here....
Office 2007 and 2010 introduced Contextual spell checker!

Follow these steps to activate the contextual spell checker:
Step 1: Click office button
Step 2: Open Word Options
Step 3: Click Proofing

Step 4: In the When Correcting Spelling and Grammar in Word section, select the Use Contextual Spelling check box. Now Click OK. That's it!
God bless the team and Bill Gates!

By the way. Here though this deals with issues like time management and prioritization,Focus-energy, here is a 2002 publication from HBR titled Beware The Busy Manager
You can download this HBR article.


Tasks and Timelines

Projectization (I'm sure this is a new word!) of every task assigned is in vogue in every corporate!
Gantt charts are simple tools to represent the project schedule and status.
There are many types with various degree of complexity, however, a simple and easy Gantt chart can be created using excel.
You will be essentially tracking
  • Who will do?
  • What will they do?
  • When will they do?
  • How long it takes to do?
I have provided a week wise planner and also day wise planner to accomplish this tracking of "Projects".
Here you can download the excel tool. you can also download it from @Downloads
Its a DO.. CO..MO.. stuff (Download, Copy ,Modify)

Coursera : MOOCs, Massive Open Online Courses

About Coursera
We are a social entrepreneurship company that partners with the top universities in the world to offer courses online for anyone to take, for free. We envision a future where the top universities are educating not only thousands of students but millions. Our technology enables the best professors to teach tens or hundreds of thousands of students.
Through this, we hope to give everyone access to the world-class education that has so far been available only to a select few. We want to empower people with education that will improve their lives, the lives of their families, and the communities they live in.

Test your Linkedin Quotient !

LinkedIn Quotient. 
Yes. It is a new, essential, corporate metric!
Here is a site that tells you how well you are leveraging LinkedIn in 2 minutes.
The site has lots of stuff to learn.
You can learn how you can unleash the power of connections.
How to make business communications on LinkedIn
Try it Out. The LinkedInman
Click her or the image to test your LinkedIn Quotient !


The ' Z ' Graph for Sales - Short, Medium and Long-term Sales analysis - All at once at a glance!

Short, Medium and Long-term Sales analysis - All at once at a glance!
Sales progress is best shown in graphs.
Here is a consultant's style of showing Long-term, Medium-term and Short-term sales progress - all in one graph. All you need is, sales data for this year till this month, and the past 12 months of sales data.
The magic of the graph is it not only throws light on the long-term, medium-term and short-term, it also can show how good is your near future going to be!
Caution! 
Show it only if you have healthy & right data...if you are facing projector lens :-)
If you are the one on the other side of the lens , never forget to ask for this graph ;-)
This is called "Z" Graph.
Now let us see what are these long term, medium-term and short term sales progress
Long term sales progress is best represented by Rolling MAT
      MAT - Moving Annual Total (sum of last 12 months data - till this month)
e.g: MAT Jan-11 = Feb-10 + Mar-10 +……+ Dec-10 + Jan-11
      MAT Feb-11 = Mar-10 + Apr-10 +……+ Dec-10 + Feb-11
Medium term sales progress is best represented by YTD
YTD - Year To Date (Cumulative sales starting from the beginning of the year ..say JAN)
e.g. YTD Apr-11 = Jan-11 + Feb-11 + Mar-11 + Apr-11
       YTD Jul-11 = Jan-11 + Feb-11 + Mar-11 + Apr-11 + May-11 + Jun-11 + Jul-11
Short term sales progress is best represented by monthly sales
e.g. Jan-11 , Feb-11 , Mar-11 , Apr-11.....
Bring all the data on to a single graph, it becomes a Z-Graph.
Do not undermine the Graph, the shape of “Z”, the angle inclination, slope of arms of “Z” can through new insights.
“Z” Graph is best for sales dashboards.
Once you plot MAT,YTD and Month, You should get a graph that more or less looks like this…

The 
Red line represents Rolling MAT
Blue represents YTD and 
Green represents Monthly sales
Just to stir your thoughts, here I present you 3 scenarios!
The shape of the “Z” should give you the complete picture.

Here is one more idea to explore...
Plot your Months-To-Go and corresponding expected YTD and expected MAT figures as per the Targets/Quotas of Months-To-Go. You may get a perfect "Z" Ora a distorted "Z" like this.....


If the shape of "Z" is... as shown in the picture, it is obvious that risk is ahead unless you have a strategy to defy the trends!
All the best!
Download the excel workbook to understand better! Click Here
alternatively @downloads on this website
It's a DO.. CO..MO.. stuff (Download, Copy ,Modify)

Acknowledgements and Reference article by David Straker
One visit to David Straker’s sites will make you a regular visitor.
....In his words….
Syque (pronounced 'sike') is my knowledge-sharing site.
My purpose is to share knowledge and understanding on an unprecedented scale, adding real value for individuals and companies. Consider it as 'original books on the internet', with already over 7,000 web pages of industrial-strength knowledge freely available.

Dymanic data on a Map - Easy method using Secret Camera object in Excel

Displaying excel data on a map is a complex task as of now.
First of all, you need to have Geocoding (latitude and longitude) of the places you want to map then create a KML map. Now, use either Internet or Google Earth to display map... It's really complex!

Here is a simple trick - hidden in excel!
This trick helps you display data automatically and with little tricks, you can make it dynamic.
You can also manipulate the data and display it by using a bit of imagination!

You got to use a "Camera Tool" in excel to do this
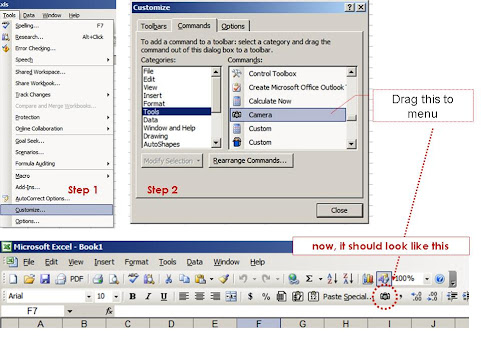
First, let me tell you where this Camera Object is hiding.... It's hidden in excel tools and you need to take it out first!

Step 1: Go to Tools on the main menu and click Customize
Step 2: In Customize,Go to Tools search for Camera.

Now hold that "Camera" and drag this to your to the toolbar on your excel.
Here is the picture to look at....
We are almost done!


In Excel 2010, The Navigation to find the Camera tool is here...


Now search for a map that meets your needs.
You can get enough and more on Google Image search - (Please check for copyrights...)
Paste the map on an excel sheet.
So now we have a Map pasted as an Image in excel and also the data to be displayed.

Now go the excel, select the range you want to display on the map
Click on the "Camera" - you will find the range - selected.
Now  - leave it on the map! Adjust the size. Do a bit of formating. Now you have the object on the map...

The magic with this is it carries the reference with it! 
Just to check, Select the object - you just left on the map. 
You will find its reference in the formula bar!
So, any change you make for the reference cell, the data in the object changes accordingly!

I added Increase and decrease tabs to make data dynamic.
You can use colours, In-cell Graphs, Dynamically change data...using the formula!
The trick is here for you to explore 
Rest, I leave to your imagination and innovation......explore it!

Take a look at the outcome.

Download the excel  here
Its a DO.. CO..MO.. stuff (Download, Copy ,Modify) You Can also download @downloads

Being Gandhi & Be in Gandhi

2'October , 143 rd Gandhi Birth Anniversary : Remembering Mahatma (Great Soul)

His Two Weapons  : Truth and non-violence.

Data Calisthenics : Gapminder Motion Chart - 5 ways to create these Motion Chart with your own data

Sometime back I wrote blog post on Gapminder.
It’s one of the most viewed posts. Here is the link for the same:
Having used and worked with the motion chart, I found that many are fascinated by the insights a Motion Chart (Gapminder) throws out. 
Boring stats Can be transformed into brilliant data dancing!
As I explore the Web world, I find many have tried various methods of presenting data the Gapminder way
Here I list out the possibilities I have come across.
It's a compilation of various methods of creating Motion Charts.
Each one is a masterpiece.. and efforts are worth a zillion claps....
The First: Use Google Docs
            The easiest way to make data dance.....
            Google Docs: MotionChart  : a Chart type in Google Docs
            Another link to explore is Quick Guide to Motion Chart
Here below is an example created by me with the Population and GDP of BRIC TM over a period of time.
The Second: Use Excel
            Making it possible in excel
Jon Peltier, author of the famous site http://peltiertech.com writes a post on how you can create motion charts in excel. Here is the link to his post
Jorge Camoes in his famous blog excelcharts. Here is his post
Anand from his brilliant blog http://www.s-anand.net/blog/
Here is the link to his post
The Third: Use Tableau
Andy Cotgreave in his Awesome Blog  Thedatastudio created a Motion chart with all possible paraphernalia on Tableau
here below are the links to his posts

The Fourth: Use Crystal Xcelsius
             http://www.ideas2evidence.com/showcase.html
             http://www.ideas2evidence.com/demos/CO2-demo.html

The Fifth : Use TrendCompass from Epic systems
          Trend compass is commercial software from Epic systems.
          Trend compass uses the basic idea of showing five variables in a single graph
          (X,Y,Bubble size, Bubble Color and Time) as a motion chart.
The user interphase is quite intuitive and simple to create Visualizations. However, for first time user, arranging data may be a challenge. The simple solution is to follow Trend Compass's instructions and their model of Excel to arrange data.
Trend Compass helps you present your business data from your own desktop without the hassle of connecting to the internet and hopping between presentation and web.
Here is a demo of Trendcompass from the website http://www.epicsyst.com/test/v2/mastercard_vs_visa/
You can download a demo version that works for 30 days....

For those who want to start from the basics, you can watch the video below from Steve


Last but not least...

You can download Gapminder for desktop
Yet another great site for data is OECD- Factbook
Though You can not use these with your own data, You have enough and more to explore..
Now...Play..... 

Problem ? I Google. I Solve.

Missing Excel 2010 Drag and Drop functionality.

'Excel 2010 has no drag and drop functionality' my friend declared.
He sulked....4 Months of suffering ....no solution…
I checked his computer. True. there is no drag and drop functionality. 

I checked my computer; Drag and drop are available… I thought it must be some excel setting.
So, I Googled.

The answer lies in a small tweak.
File > Options > Advanced
Enable fill handle and cell drag-and-drop: Ensure the box is checked.
Take a look at this Picture here the Box is not checked. So Check It....That's the Solution 


Problem? I Google. I Solve.
Four months of suffering  Vs.  Instant solution the difference is ….a friend called 


Sales Forecasting : Easy and Simple


Sales Forecasting is a Paradox. 

Theoretically, Faaaarther the Period, Poorer the Reliability.
Whereas, in the real world its the opposite...This month, not very sure; year end, guarantee. ;-)
I may not solve the Paradox but, here is a easy and simple tool to forecast sales.
Two simple rules and a bit of Stats were used to create this tool in Excel.
       ~ The near future most likely will be an extension of our known past....
           Like we know that tomorrow should more or less will be like today...The Armageddon is far away
       ~  Seasonality exists in sales and the reason may not always be the Mother nature
           Like we know soft drinks sell during summer and on a sales closing day, we do more sales
Download the Excel and take a look at the Powerpoint to understand and use the tool.
This is a DOCOMO stuff! (Download,Copy and Modify at your will...You can find them @Downloads

Wangiri Calls : One Ring and Cut Calls


India knows the "value" of nothingness.
Ancient India invented Zero. 
Modern India Invented missed Call.
The whole world embraced both the inventions with high intensity.
This post is about the making 'misuse' of the invention called 'missed call' by some unscrupulous people.
I recently received a couple of missed calls from overseas. I tried returning the call but heard a recorded voice say that this is an international call and is chargeable. Little unusual. 
So, I Goggled the number to find innumerable posts confirming that it is a fake call.
Yesterday another call with +44 identifiable as England. But the number is unknown.I returned the call but this time no recorded voice. So I had the chance of hearing some husky Ohs.. and acoustic Ahs.. (once again, recorded I believe!)
It took me about 7 sec. to understand that it’s a chargeable porn call. So I dropped the call. I am sure I must have been charged for those 7-8 Secs. at a premium rate. It makes sense to presume that these numbers are premium rate International calls.
So, the moral of the story is ….
India invented missed call! Others have created a business case around it.
What an Idea Sirji!
Indian missed call is Communication. Overseas missed call means Commercialization.
Action : Ignore missed calls from unknown numbers ( Called Wangiri Calls: literally,' One (ring) and cut')
PS: My Google Gyan: 

Computing trendline values in Excel

Forecasting is an Art,Science,Social studies,Maths and more 
From www.Forexmillion.com
Use of trends can make forecasting easy ! And God's gift to corporate mankind can make it easier !( Well, I 'am referring to Excel)
However, the trend line in excel does not display the values it holds. Computing the values on excel is an extremely confusing stuff .
You need to use innumerable formulae in excel to arrive at the values.
Just to make the job easy, here I present a way to do it. I have also attached an excel file link in the presentation. You can download the same and use it.
Alternatively you can download it from my BOX: Trendlines.XLS
Computing trendline values in excel