I am selfish. I want to live twice. I donated my organs : Repost

Logo from Committee of Organ Donation in Lebanon


God bestowed us with the power to donate life.
I donated my organs. Have you ?
By donating your organs after you die,
you can save or improve as many as 80 lives.
If you still have doubts
Mayoclinic : Organ donation: Don't let these myths confuse you
Listen to TED Talk by Dr. Chris Barry, a transplant surgeon from Rochester Medical Center.

Mobile Simulator for your Website : Mobilizer

It's a simple no-nonsense tool to demonstrate your mobile websites, mobile SFA tools in action. You can save them as images for your presentations.
Its really good...Very simple to use for demonstrations.
Here is how LCDing shows up on various mobiles...


Mobilizer from Spring box
Enables users to showcase design mockups, mobile websites, and local HTML in life-like form. Fast and easy to use, users simply choose a device, enter a URL or design, and Mobilizer instantly constructs a vivid, pixel-accurate display- ready for presentations, pitches and portfolios. 


Search Google by Image

Have you ever tried searching Google for an image you already have? Take a look.


Want to learn more on how to search Google ? Watch this video.

He is from a B school called "Life"

Here is a video shared by my colleague on Whats' App.
There is a lot to learn from this small clip for 2 Mins.
Do not miss it.


Column and Stacked Column - Mixed Chart in Excel and PowerPoint

Couple of days back a friend of mine came to me and asked for help to create a chart that should
display the mother brand's objective as column chart and its line extensions sales achievement as stacked chart month by month.
This may also be used to show objective of the Brand Vs. Sales achievement of various SKUs.(stock-keeping unit).
Well , neither Excel not PowerPoint has an option to mix two chart types in a single chart.
So, I tried and created a simple cheat.

Here is the Chart.

Take a look and use the PowerPoint template for the same. 

In-Sin

Well, we all know that our Personal world is different from Social (Media) world.
The fundamental difference is,  in my personal world it's  one to few and few to one interaction 
Whereas in social world, it's  one to many and many to one.
well, you may or may not know many in that many :-)


I can exercise my choices in my personal world. whereas I need to abide by unsaid social rules in the other social world because it takes all kinds of people to make this world.


Here is my learning from some of my own connections and interactions on LinkedIn.
I call each one of them as "inSin". 

I will try to avoid those.....


Open Office : Best ever free Office Site

Compatible with other major office suites, Apache OpenOffice is free to download, use, and distribute. Download it now, and get:

  • Writer a word processor you can use for anything from writing a quick letter to producing an entire book.
  • Calc a powerful spreadsheet with all the tools you need to calculate, analyze, and present your data in numerical reports or sizzling graphics.
  • Impress the fastest, most powerful way to create effective multimedia presentations.
  • Draw lets you produce everything from simple diagrams to dynamic 3D illustrations.
  • Base lets you manipulate databases seamlessly. Create and modify tables, forms, queries, and reports, all from within Apache OpenOffice.
  • Math lets you create mathematical equations with a graphic user interface or by directly typing your formulas into the equation editor.

PDF to PPTX : Converting PDFs to Powerpoint : Absolutely free

So, you need to convert a PDF into a PowerPoint.  
This usually happens when you get "Inspired" by some presentation from Slideshare.
Here is a simple way to do so by using..

1. PDFill : PDFill is a brilliant piece of software which is absolutely free and can do lots of amazing things with PDF Files. You can download it here.

2. PowerPoint: Hope you have Office 2010 .
In case you do not have one try the best free alternative: Open Office 4.0

Two  Simple Steps
Step 1 :
Use PDFill to convert all pages of PDF into Images and store them in a folder.
All pages will get converted into pictures in an instant.


Step 2 :
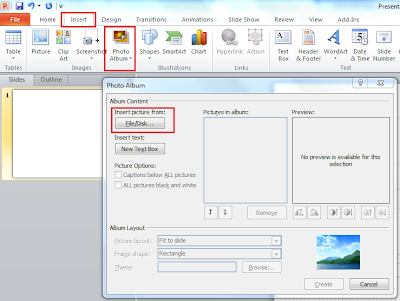
Use the "Photo Album" feature to convert all the images created with PDFill into slides.
All pictures in the folder will get converted into pictures into a presentation in a jiffy.


Next time when you have the challenge to convert a PDF to PowerPoint, Remember this trick :-)

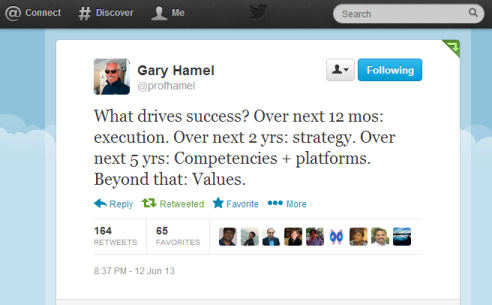
New Lingo Learned @ FFE 2013

Yesterday, I had the privilege of attending  FFE 2013 organized by Medicin Man
It was a day of wonderful Learning and Networking. 
Rubbing shoulders with Who is Who of the Indian Pharma is exhilarating. 
Learning from Leaders and CEOs who rose from the ranks of MRs is indeed an experience to cherish!

Here is the Neo Lingo I learned...


Click the logo below or click the link to subscribe to Free Magzine " Medicin Man " for Field Force Excellence.

Online Survey or Quiz - Absolutely Free and No Limitations: Google Forms

Want an Opinion Poll?  Wish to conduct a Survey? Planning a Quiz after a training programme?
Think Google.
Free online quiz or survey is made easy with Google Docs. You can use Forms to create an online quiz. It's easy and very intuitive. 
You can create questions with various answer options like
  • Text
  • Paragraph
  • Multiple choice
  • Checkboxes
  • Choose from a List
  • Scale and 
  • Grid
Google provides many themes to garnish your quiz. 
The created Quiz/Survey can be sent by integrating with the mail. Moreover, you can collect and analyze the responses in real-time. 
The data gets loaded into Google Spreadsheet thus making analysis of data easy!
You can download data into spreadsheets on your desktop.
A pre-formatted summary is also available for a quick look.
Next time when you plan for an Online Quiz, 
Rely on Google Docs.
You can even embed the form into your website. 
Alternatives are 
Survey Monkey and
Survey Gizmo
Most of the basic features are free but you may find few limitations.
Google Docs is limitation free :-)
It's simple, easy and free.
In case you need help Refer to Google forms.
Here is the link: Google forms-Help


Take a tour...


Mean,Median and Mode - When and Where?

If you know only 'Average' and do not know much about the words  'Mean', 'Median' and 'Mode’, you are lucky!!  Those who know, always get confused about  When to use it? Which measure to use?
However, clarity helps understand things better.
Let us take the classical example of average income in two localities in Mumbai and try to understand these....
     Locality 1, say Mulund where multi-storied flats co-exist with slums around it.
     Locality 2, say South Mumbai where only Multi-storied flats exist and no slums.
Mean a.k.a Average
When to use Mean?  Mean is also called Average. 
You average out when things are similar or symmetrical. Isn’t it? 
So, in the above-mentioned localities where do you use mean? 
Obviously, in a locality where you find similarity in the population.
i.e. Locality 2 – only multi-storied flats.
Mean is the best measure when the distribution is not skewed.
This means, when symmetry exists use Mean.
Median
Median is the best choice in locality 1 because the distribution is skewed.
(High Income of the people residing in flats and presumably low income in people residing in slums). 
Few People who have disproportionately high income and few with very low income (these are called Outliers) can completely skew and distort the picture.
So , the moral of the story is next time when you are offered a job ask for the median salary of the post rather than the average salary for the post offered!
Mode 
Mode is most recurring or most often seen.
Mode is the least used measure of central tendency. 
Often you find it is not very meaningful.
Lets take the example: The salaries in an office with 6 people are as follows.
Rs.10,000, Rs.10,000, Rs.7,590, Rs.7,550, Rs.2,200 and Rs.7,565.
So, the Mode is most recurring i.e. Rs. 10,000 ( it appeared Twice).
This is not reflecting central tendency. It’s meaningless.
But where do you find Mode useful?
Let’s take this example which may be more meaningful for Gentlemen!
You are standing in a typical Mumbai Bus stop and watching women's dressing!
A Sari , Jeans, Chudidaar or Skirts.
At At the end of the day, if you are not arrested by Police, you come to a conclusion, that most women in Mumbai wear Jeans! (Quite an insight).
So, Mode is the best measure for Nominal data (such as Sex, Race, Ethnicity, Country etc.)

To summarize,
Mean is the Average, Median is Middle and Mode is Most often.
Mean tells the basic character of a population. It does not represent an individual from the population. In reality, you may not find anyone matching the mean in the population.
Median represents a typical Individual from the population.
Mode is most often observed.
Learn with this simple song for a better understanding..

Effective Frequency - Advertising Frequency Theory

Looooong ago Thomas Smith , a London businessman wrote a book called 'Guide to Successful Advertising' in the year 1885! He says it takes at least 20 times for one to be exposed to an ad to make a decision!
Observe at what point the Herbert Krugman's three levels of exposure namely Curiosity, Recognition and Decision are at work !

No one can dispute the power of Frequency... 
However, we need to estimate and carefully judge Reach Vs Frequency and Quality Vs Quantity.
In India, Washing Powder ..... is Nirma.
Thanda Matlab .... Coca-Cola!
What must have made these Brands as generics?
Is it Reach or Frequency or an ideal admixture of both?
Watch the list...
Aspirin is Bayer’s brand of acetylsalicylic acid.
Cellophane is a trademark of Innovia Films Ltd.
Dry ice  is a trademark by the Dry Ice Corporation of America.
Escalator is a Trademark of Otis.
Petrol   is a trade name.
Videotape is a Trade name of Ampex Corporation.
Xerox is a Brand name of a Photocopying machine.

VIRUS is a.k.a Viru Sahasrabuddhe

VIRUS is aka Viru Sahasrabuddhe.(not the other way round !!)
Thanks to the film 3 Idiots, we experienced the power of Acronyms.
Incidentally, yet another 'VIRUS' is Vital Information Resources Under Siege.

It's not uncommon to search for a catchy name for your project. Well, the name should double as an acronym and reflect the essence of the project. What do you do?
Here is a free cool tool on the web….called
 ACE Acronym Creator
Give the words that best describe your project or concept or give a phrase. The tool generates hundreds of acronyms to choose from.
Here is the link
http://acronymcreator.net/


Sometimes, you have a name and you need to add words to each letter. Try it!

http://www.go-quiz.com/acronym/acronym.php
Sometimes you have the letters to Jumble. Here are Jumble solver links!
http://www.specialist-online-dictionary.com/word-unscrambler.html
http://www.vandine.biz/jumble_new.php
http://ull.chemistry.uakron.edu/solveit.html

Now,  go Acronym hunting ...

http://www.mindmapinspiration.com/

Chanakya Niti


Here is a collection of Chanakya's preachings and few important links to the original work by
Shri R Shama Sastry and other links to sites giving the essence of his work.
My contribution: copy-pasting of a few of the quotes and wisdom referred to as Chanakya Niti into a PowerPoint.

Here are few words about Shri R Shama Sastry who Translated "Arthasastra ":

Rudrapatnam Shamasastry (1868–1944) was a Sanskrit scholar and librarian at the Oriental Research Institute Mysore who is known for discovering and publishing theArthasastra, an ancient Indian treatise on statecrafteconomic policy and military strategy.
The Oriental Research Institute was set up in 1891, as the Government Oriental Library, Mysore. It housed thousands of Sanskrit palm-leaf manuscripts. Shamasastry, the librarian, examined these fragile manuscripts daily, to determine their contents and catalogue them.
In 1905 he discovered the Arthasastra among a heap of Palm leaf manuscripts. He transcribed, edited and published the Sanskrit edition in 1909. He proceeded to translate it into English, publishing it in 1915.[2]
The manuscript was in the Grantha script. Other copies of the Arthasastra were discovered later in other parts of India.
It was one of the manuscripts in the library that had been handed over by 'a pandit of the Tanjore district' to the Oriental Library.
Until this discovery, the Arthasastra was known only through references to it in works by Dandin, Bana, Vishnusarma, Mallinathasuri, Megasthenes, etc. This discovery was "an epoch-making event in the history of the study of ancient Indian polity". It altered the perception of ancient India and changed the course of history studies, notably the false belief of European scholars at the time that Indians learnt the art of administration from the Greeks. The book was translated into French, German and many other languages.

All his works received great attention from many great Scholars around the world, particularly European Indianists. Several titles were also conferred on him, including Arthasastra Visharada by the Maharaja of Mysore, Mahamahopadhyaya by the Government of India, and Vidyalankara and Panditaraja by the Varanasi Sanskrit Mandali.
Text Copied from Wikipedia

The Art of War

Sun Tzu is also known as Sun Wu is an ancient Chinese Military General, Strategist and a Philosopher.
He is known to have authored a masterpiece that stood the test of time.
2000 years back the strategies he conceived still hold an important place in today’s world. 
The corporate world has enough and more to learn from his work.

Here is the summary just in seven points.


Want to read more? Here are few links....Search Google for a million links...

The Art of War -Translated Version
Review Article in Oxford Leadership Journal


Concentration Curves : Tool for Resource Optimization

Every organization in these times is working against odds. One of the major actions of organizations during tough times is Ephemeralization or  "Do more with less"
During these tough times, organizations need to constantly evaluate their resource utilization and undertake  Optimization of the process so that you can really "Do more with less".
To me, resource Optimization is not cutting resources. It’s putting resources to good use.

This principle holds good not only for organizations but also individuals who are attempting to optimize resources available to them. All you need to do is identify is the resources!

There are many tools to undertake work towards Resource optimization. 
One of the easiest and fastest is creating "Concentration curves".
Once you understand the basic concept, you can use it with Resources and Outcomes like Sales Vs. People deployed,  Sales Vs. Expenses Sales Vs. Time invested etc.
Concentration curves are simply a Graphical representation of Cumulated Outcomes Vs Cumulated Resources. In the graph,
     ~ The Vertical axis(Y-Axis)holds Cumulated Outcomes and
     ~ Horizontal Axis (X-Axis) holds Cumulated Resources.
So at a given point on the graph, you know exactly how much is the Outcome Vs. Resources were used to generate the Outcome. Take a look at this example on concentration curves of GDP of  181 countries and their contribution to World GDP. You can observe that 35 Countries Contribute to 90% of the World GDP and the Rest of the 146 countries contribute to a mere 10% of the World GDP.


So the information you get will be something like this.
~ 20% of the field force give us about 80% of the sales
~ 40% of the money spent  on the brand gave us 95% of the sales
~ 25% of Territories are responsible for 70% of the Sales generated
~ 20 Members out of 125 salesforces produce 75% of the Sales.

Does that ring a bell?  Yes.. 
It's akin to Pareto Chart,  Lorenz Curves  for Gini Calculations.
You may refer to my earlier post: What is GINI ? for more information

Coming back to concentration curves, Here is an example. 
This demonstrates World GDP with GDP of countries on Y-Axis  Vs  No. of Countries on X-Axis.
I have created a Template for you. You can create concentration curves using your own data.
Here are 3 simple steps
  1.Paste data in coloured cells. The rest of the computations are automatic.(In fact computations are simple)
  2.Tweak the slider to match your data (Shown in downloadable excel file)
  3.Read values at each data point by using the slider. 

Download the Concentration Curves Tool  Here
This is a DOCOMO stuff! (Download,Copy and Modify at your will...You can find them @Downloads


Bidding for the Patient : Empowerment to patient

Sometime back,I was asked about 'Indian Pharma / Healthcare  Crystal Ball' and I made some notes....Here is a small portion of the same.....
"Medical tourism both from foreign countries and within India will grow. Hospitals may bid for a patient on price and quality for a given surgery. Patients can shop online for comprehensive care and cost."
Here we go.. Today I received a message about the announcement of a new website ... Take a look...
Let's wait and watch How the market grows. Congrats to www.Medeel.com


Sutton's Law

Willie Sutton
Taken from Wikipedia
Willie Sutton was Top 10 most wanted figurative of FBI with charges of Bank robbery. Wikipedia says  During his forty-year criminal career he stole an estimated $2 million and eventually spent more than half his adult life in prison.
He is famous for his answer to a reporter who asked him why he does Bank robberies.
he simply answered:  "because that's where the money is." 
This quote is the very basis of Sutton's law. 

This means you should search for the "Obvious" while analysing or diagnosing things.
So, when you are in search of the obvious, you are expected to do those tests in a sequence that would result in the most effective diagnosis or analysis.

An extension of the same in medical parlance is....
When you hear hoofbeats behind you, think horses, not Zebras..

By the way...next time when you take up the task of analyzing a business problem, remember Sutton's law!
Such approaches in a business environment can minimize analysis paralysis


Make life easy with Shortcuts

The Excel & The PowerPoint.
Like them or hate them! You have no choice. 
You may say to yourself that this need not be your core skill. But deep in your heart, you know, you must be fairly conversant with these Two 'God's Gifts' to corporate mankind for your survival. 
Here are PowerPoint and excel shortcuts that can make your life easy. These were chosen after careful consideration of the everyday work of an executive.

The Primordial necessities: Both Excel and PowerPoint
~ CTRL+A : Select
~ CTRL+C : Copy
~ CTRL+V : Paste
~ CTRL+Z : Undo the mistake
~ CTRL+S  : Save
~ F7 :Spell Checker
PowerPoint S.Cuts.,
~ CTRL+ M : Insert New Slide
~ CTRL+SHIFT + > or < : Increase or Decrease font Size
~ CTRL+ K : Create a Hyperlink
~ F5 : Go to Presentation Mode
~ Shift + F5 - View the slide show from the current slide forward
~ B or . (Period) : In the presentation mode to make the screen go Blank/Black and back to Presentation.
~ Home: Go to the First slide. 
~ End : Go to the Last Slide
Excel  S.Cuts.,
CTRL +Arrow keys : Go to the end of a Range ( Use Up/Down/Right/Left arrow keys)
~ CTRL+ Pageup or Page Down : Switch between worksheets
~ SHIFT+ Arrow Keys : Select a Cell Range
~ CTRL+SHIFT+Page up/Page down : Select a cell Range to the last cell with Data
~ ALT+ENTER  : Insert a new line within a cell
~ F2 : Check the formula references
~ F4 : Add $ sign for a Reference
~ F11 : Select a cell range and show an instant graph.
Use them regularly. They can save your time! 
Lots of Your Time. Trust me!